
Machine Learning Evaluation Metrics
Introduction
Evaluating your machine learning model is a crucial part of any project. Your model may give satisfactory results when evaluated using metrics such as accuracy but may perform poorly when evaluated against other metrics such as loss or F1 score.
In most cases, we use accuracy to measure the model performance, however, it is not enough to truly judge our model. Thus, let’s take a look at different evaluation metrics available.
Confusion Matrix
Confusion Matrix is a performance measurement for a machine learning classification problem where output can be two or more classes. It is a table with 4 different combinations of predicted and actual values as shown below.
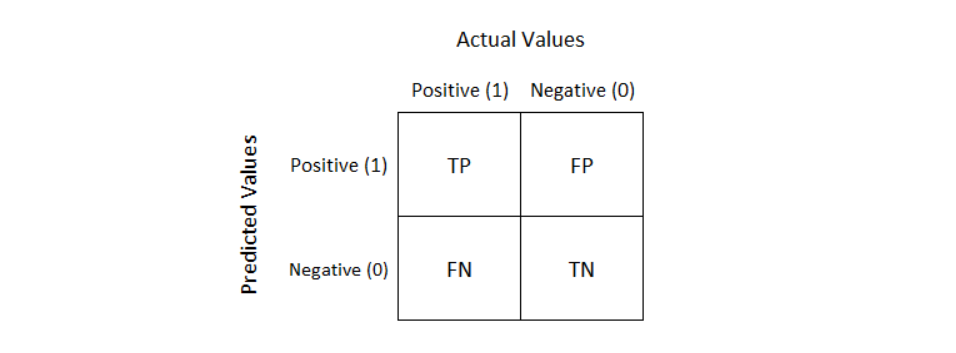
It is very useful for measuring other evaluation metrics such as Recall, Precision, Specificity, Accuracy, and most importantly AUC-ROC Curve.
Following is an example in terms of pregnancy analogy to help you better understand TP, TN, FP, and FN.
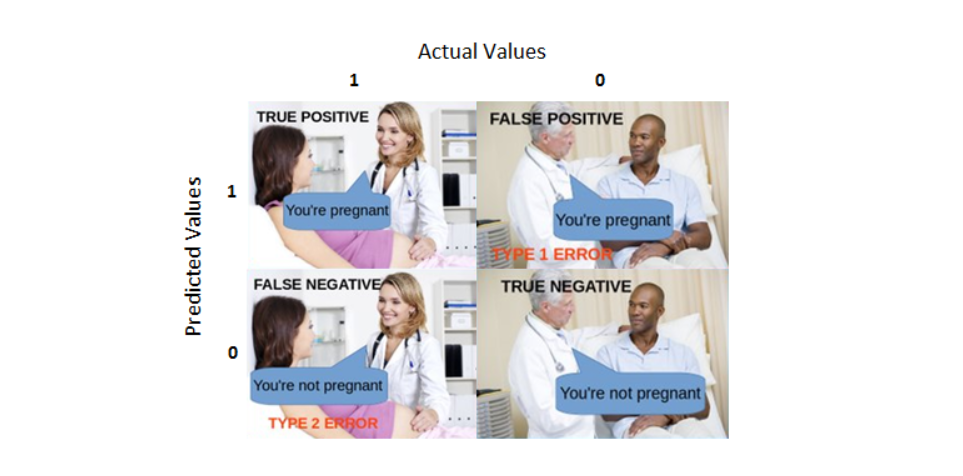
True Positive
Interpretation: You predicted positive and it’s true.
You predicted that a woman is pregnant and she actually is.
True Negative
Interpretation: You predicted negative and it’s true.
You predicted that a man is not pregnant and he actually is not.
False Positive (Type 1 Error)
Interpretation: You predicted positive and it’s false.
You predicted that a man is pregnant but he actually is not.
False Negative (Type 2 Error)
Interpretation: You predicted negative and it’s false.
You predicted that a woman is not pregnant but she actually is.
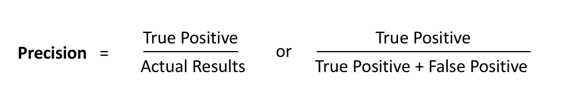
Positive Predictive Value (PPV) or Precision
Precision is the number of correct positive results divided by the number of positive results predicted by the classifier.
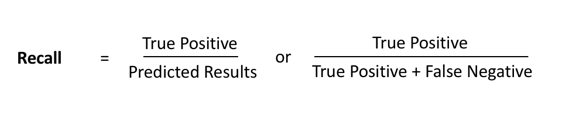
Sensitivity or Recall
Sensitivity or Recall is another important metric, which is defined as the fraction of samples from a class that is correctly predicted by the model.
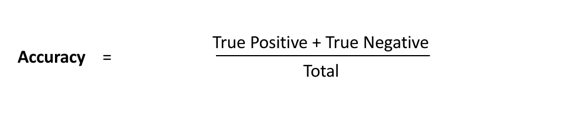
Accuracy
Accuracy is perhaps the simplest metrics one can imagine and is defined as the number of correct predictions divided by the total number of predictions, multiplied by 100.
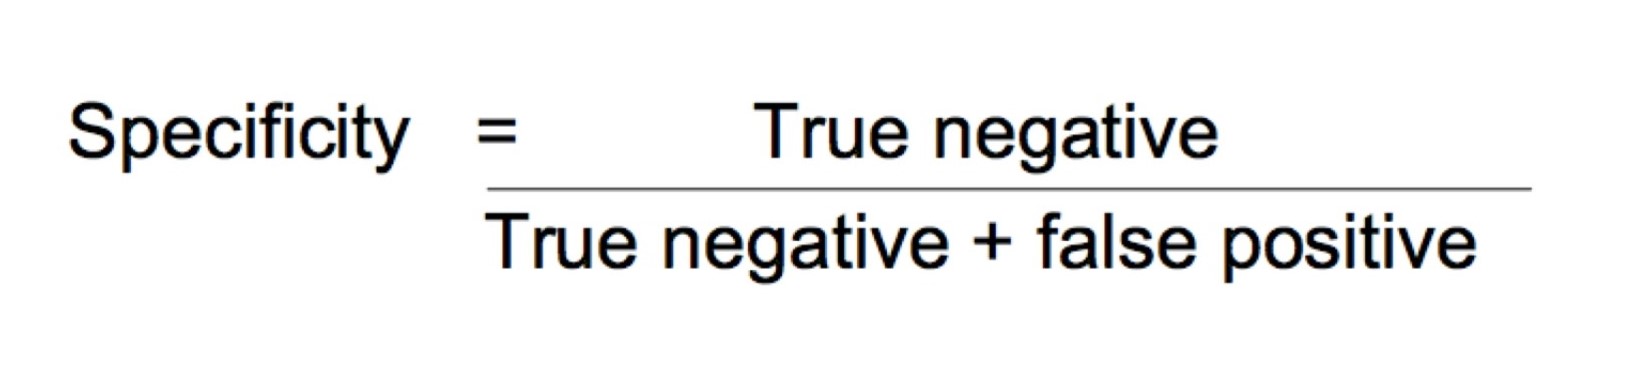
Specificity or True Negative Rate
Specificity is the true negative rate or the proportion of true negatives to everything that should have been classified as negative.
Dice Coefficient (F1 Score)
Dice Coefficient or F1 Score is the Harmonic Mean between precision and recall. The range for the F1 Score is [0, 1].
It tells you how precise your classifier is (how many instances it classifies correctly), as well as how robust it is (it does not miss a significant number of instances).

Average Precision (AP)
Although the precision-recall curve can be used to evaluate the performance of a detector, it is not easy to compare among different detectors when the curves intersect with each other. It would be better if we have a numerical metric that can be used directly for the comparison.
This is where Average Precision (AP), which is based on the precision-recall curve, comes into play. In essence, AP is the precision averaged across all unique recall levels.
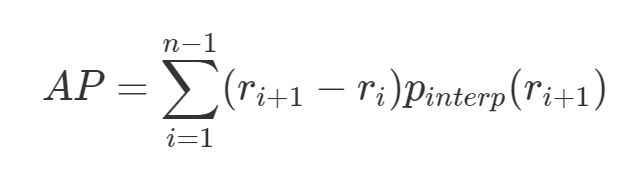
where, r1, r2, r3, …, rn are the recall levels at which the precision is first interpolated.
ROC Curve
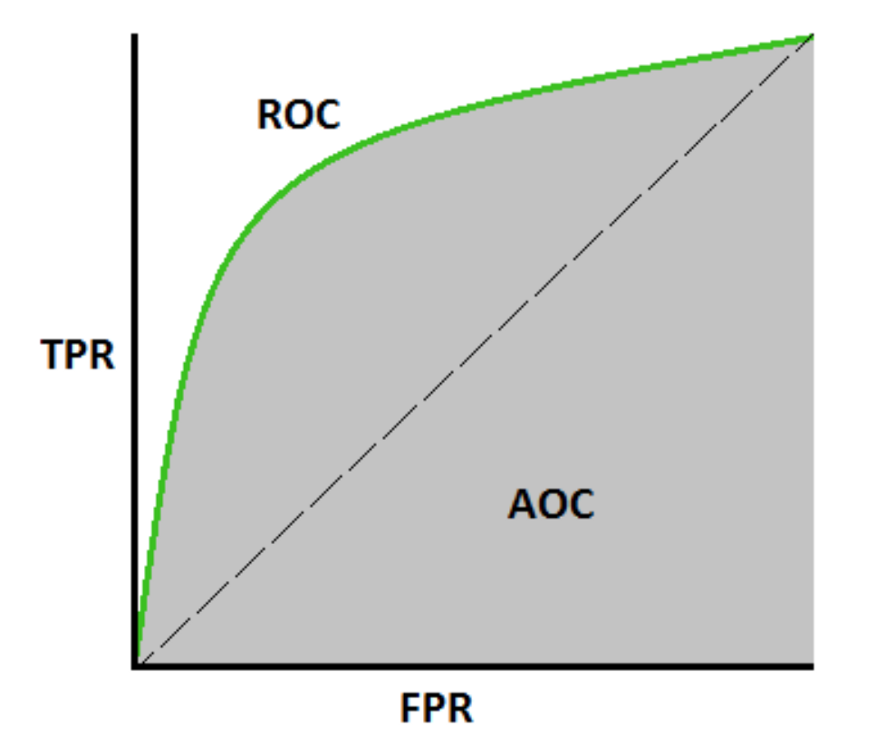
The Receiver Operating Characteristic curve is a plot that shows the performance of a binary classifier as a function of its cut-off threshold.
It essentially shows the True Positive Rate (TPR) against the False Positive Rate (FPR) for various threshold values.
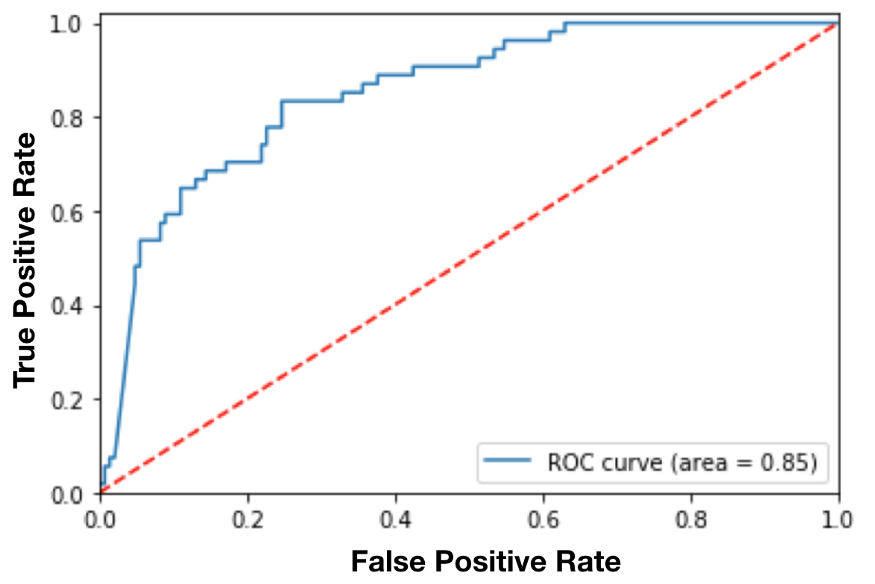
AUC
The Area Under the Curve (AUC), is an aggregated measure of performance of a binary classifier on all possible threshold values (and therefore it is threshold invariant).
AUC calculates the area under the ROC curve, and therefore it is between 0 and 1. One way of interpreting AUC is the probability that the model ranks a random positive example more highly than a random negative example.
Youden’s index
Youden’s J statistic (also called Youden’s index) is a single statistic that captures the performance of a dichotomous (A partition of a whole into two) diagnostic tests.
Youden’s J statistic is
J = sensitivity + specificity - 1
The right-hand two quantities are sensitivity and specificity and thus, the expanded formula is as follows:
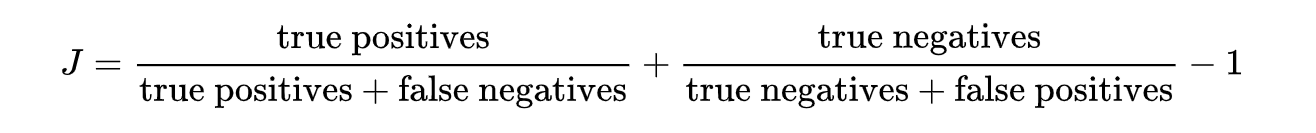
Youden’s index is often used in conjunction with receiver operating characteristic (ROC) analysis. The index is defined for all points of a ROC curve, and the maximum value of the index may be used as a criterion for selecting the optimum cut-off point when a diagnostic test gives a numeric rather than a dichotomous result.